
July 30, 2020
Performance
Analysis and Sports Technology
NETWORK THEORY CAN BE APPLIED IN TECHNICAL DECISION MAKING
Advances in technology and the application of science are increasingly making it possible to decipher everything that happens on the pitch during games and whole seasons. In this case, applying network theory to football is simply one more method to obtain additional information about a football match.
Javier Martín, at a talk in La Masía, explained the conclusions of the research Defining a historic football team: Using Network Science to analyze Guardiola’s F.C. Barcelona by Xavier Busquets, I. Irigoyen, Paco Seirul·lo and him. This use of network theory enables a new tool to assess how a team plays, and therefore can be used to establish strategies: “It is going to give you one more point of view and then the coach decides. Maybe you are right with less information, but to make good decisions you always need the most information available and take into account the greatest number of factors that have influenced the final result”.
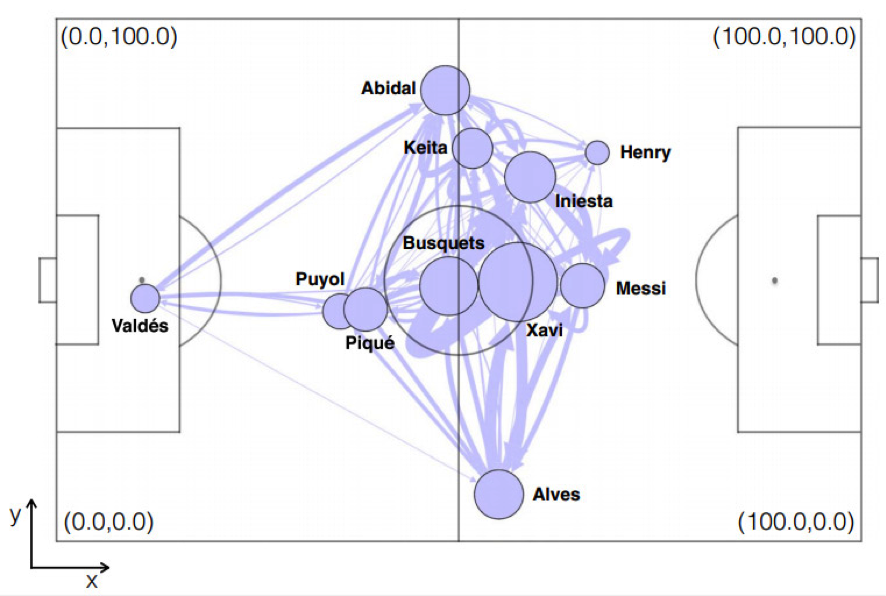
This new system consists in the search for patterns based on the interaction of the players. The nodes (footballers) are related to each other through the pass, which creates a superior structure. Depending on how many passes depart from each node, from where and with what average and efficiency, the different systems that have been established can be analysed, defining the patterns and the data, results, that each one generates. Information that would be useful for the coaching staff.
The calculation method starts exclusively from the data provided by the passes that happen during a game. The moment in which it happens, the team and the player, the coordinates of the pass, the receiver and the coordinates of the next pass are recorded. Each pass is a connection between two players. If it is repeated, it increases the weight of that connection.
This means that the networks that are calculated are directed and weighed, that is, that each connection has a direction arrow and a volume, the number of passes between the same nodes is shown with greater or lesser thickness. In conclusion, with all these variables, the centroid of the network is found, which is the average situation from which all passes have happened, which is not necessarily translated into the position of the players, although it is related. It is simply a coefficient.
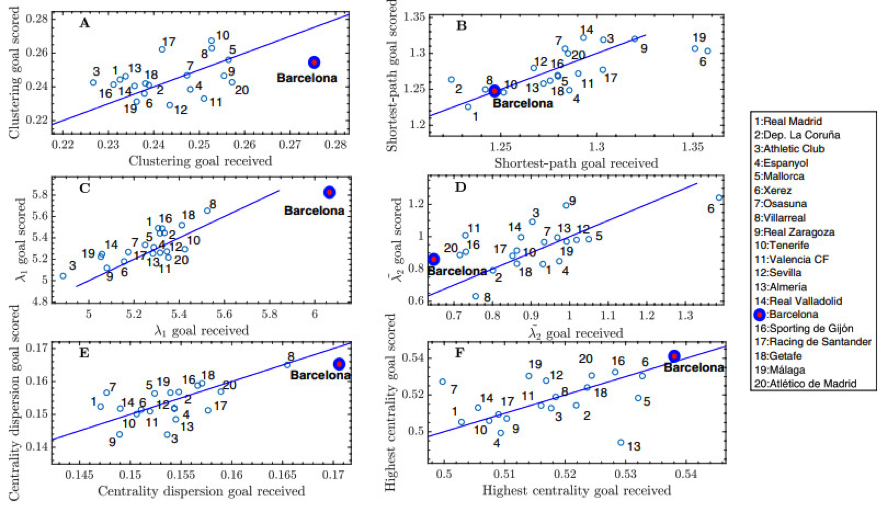
From here, fundamental data to check the effectiveness of a playing system are triangulations. In any type of network, the triangle is a very robust structure because it means that there are more possibilities to connect the nodes. If a connection is interrupted (a player is marked and cannot make a pass, for example) triangulation makes it easier for them to get the ball where they want. Where this happens most frequently, technically, would be a high clustering network.
Only with this, the statistically significant differences between the teams can already be appreciated. In the case of Guardiola’s FC Barcelona for the 2009-10 season, with the treatment of this data, it was already observed that Barça’s clustering was superior to that of other rivals and that it used a play, a type of combination, more in parallel to the goal than vertical. Information that reflected a play of possession that dominated until finding and opening spaces within the rival to trigger the goal action.
In this aspect, when the arrangement of the team’s passes is measured when it comes to scoring and receiving a goal, Barça showed a difference. That is, the parallel passes were more when it scored and less when it received the goal. One of the most interesting data that can be calculated from these parameters is the risk of receiving a goal that a team has depending on the type of network that it presents at all times. Barça received goals when it was least faithful to its usual system.
Another method of calculation would be forgetting the players as a node and placing this in the pitch plots. In this way you can calculate the movements of the ball between different areas and, above all, how much playing field a team covers. If this parcelling of the lawn is progressively subdivided, areas from which there have not been passes gradually appear. In the case of the study that Javier Martín has done on FC Barcelona, it showed to be the team that systematically covered the most amount of the field compared to all the rivals in the league when applying this procedure.
The identifiability of a team can also be calculated. By the use of a matrix, you can know how connected one area of the field is to another. If they are compared game after game, it can help to find out how similar that team plays each match and if it is a consistent team by always playing in a very similar way. Simultaneously, it can be calculated if it plays very similar and at the same time differently from the others. This is what would allow a team to be identified as identifiable. According to the 2018-19 season data, FC Barcelona was the most identifiable team, followed by Real Madrid, Atlético de Madrid, and Real Betis, then trained by Quique Setién.
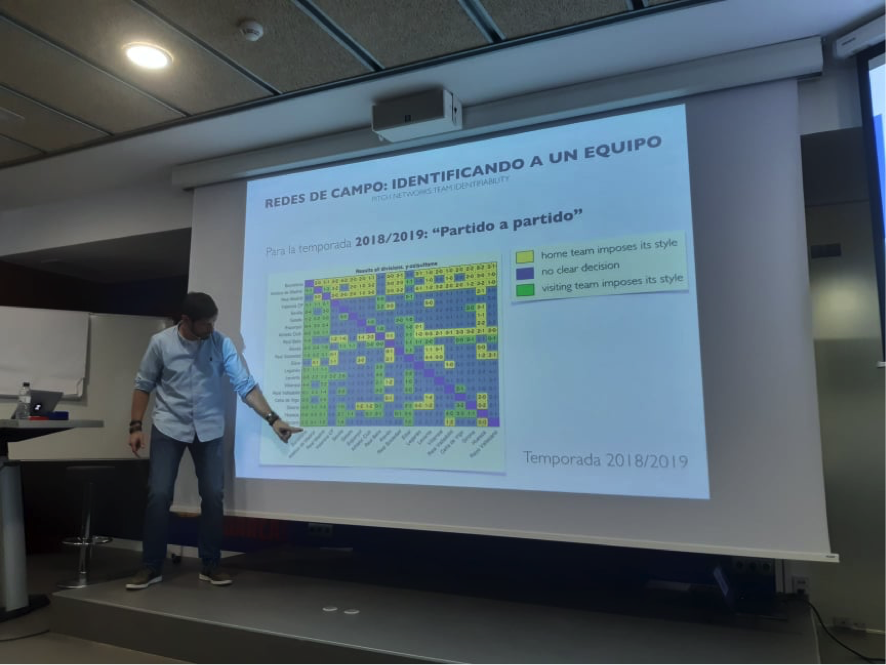
In a table of results that collected all the information corresponding to the season, it shows how the style of play of each match tended. In the case of FC Barcelona, Real Madrid, Atlético de Madrid, and Real Betis, in most of the games they played, they imposed their style at home (yellow) and as visitors (green). The relevant information is that we can know the effectiveness on the scoreboard of an identifiable system that manages to impose itself, since there are cases in which the system is imposed, but the game is lost. Although the rule rather than the exception is that whoever imposes their style, ends up higher in the table.
However, this data, added Xavier Busquets, doesn’t imply that a team, for being identifiable, is predictable. Precisely, it is the contrary. When a team has a style that achieves positive results, what it means is that it imposes an internal order that generates disorder in the rival. Nevertheless, a team that meets all these characteristics cannot be mythicised either, because then the play would be predictable indeed. You also have to take into account if the system is open to receive new information so as to create new formulas that continue to generate disorder in the rival. Summed up in one word: surprising.
For an optimisation of the tool, it is pending to weigh the quality of the passes, which logically do not have the same value if they are performed routinely in the centre of the field, if they enable a player in a danger zone or if it is goal assistance. It is also expected to add to the equation of how far a player advances with the ball before passing the ball and the length of each pass, two complex parameters to deal with because they trigger the variables.
Furthermore, as a statistical model, with the work performed so far, historical records could already be established from which in the mid-term we can obtain information about the patterns of, for example, each coach: how they play under certain circumstances, types of rivals and what results they get.
BIHUB team
KNOW MORE
CATEGORY: MARKETING, COMMUNICATION AND MANAGEMENT
This model looks to the future with the requirements and demands of a new era of stadiums, directed toward improving and fulfilling the experiences of fans and spectators, remembering “feeling” and “passion” when designing their business model.
CATEGORY: FOOTBALL SPORTS PERFORMANCE
Through the use of computer vision we can identify some shortcomings in the body orientation of players in different game situations.
CATEGORY: MEDICINE HEALTH AND WELLNESS
A health check must detect situations which, despite not showing obvious symptoms, may endanger athletes subject to the highest demands.
CATEGORY: FOOTBALL TEAM SPORTS
In the words of Johan Cruyff, “Players, in reality, have the ball for 3 minutes, on average. So, the most important thing is: what do you do during those 87 minutes when you do not have the ball? That is what determines whether you’re a good player or not.”
CATEGORY: MEDICINE HEALTH AND WELLNESS SPORTS PERFORMANCE
Muscle injuries account for more than 30% of all injuries in sports like soccer. Their significance is therefore enormous in terms of training sessions and lost game time.
DO YOU WANT TO KNOW MORE?
- SUBSCRIBE
- CONTACT
- APPLY
KEEP UP TO DATE WITH OUR NEWS
Do you have any questions about Barça Universitas?
- Startup
- Research Center
- Corporate