
Football analytics isn’t just about numbers. It is about creating the patterns of play that win matches. Here, we look at how coaches can work with data scientists to do exactly that.
In the previous article in this series, I looked at how single numbers, in the form of Key Performance Indices (KPIs) can help a whole club – the players, the manager and coaching staff, the board and even the fans – work together towards a clearly defined goal. The statistic I concentrated on was the “five-second rule”: measuring how often a team wins back a lost ball within 5 seconds.
It is one thing to have a KPI which measures success on the pitch, it is quite another to find novel ways of producing that success. It is here that patterns come into analytics: how do we organize the team to improve performance?
Manchester City’s successful example
Frequently, when we hear about the “5-second rule”, we are told that the key is for players to immediately press the opposition when they lose the ball. This is certainly important; we need commitment from all players in order to succeed. But commitment is not, in itself, enough. We also require organization. We need the correct spatial pattern.
The image below shows a situation in the 77th minute of Manchester City’s visit to Manchester United in the 2020/21 season.
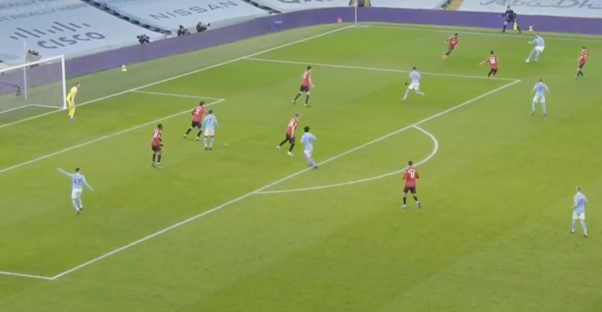
Manchester City are attacking with four players in the box. What I want to draw your attention to here is the positions of three players:
- Kevin De Bruyne (17) who is just outside the box,
- Ilkay Gündogan (8) who is on his way into the box and
- Oleksandr Zinchenko (11) who is on the bottom right of the picture.
We can also view this through pitch control, which shows which player would get to the ball first if it were at that point on the pitch.
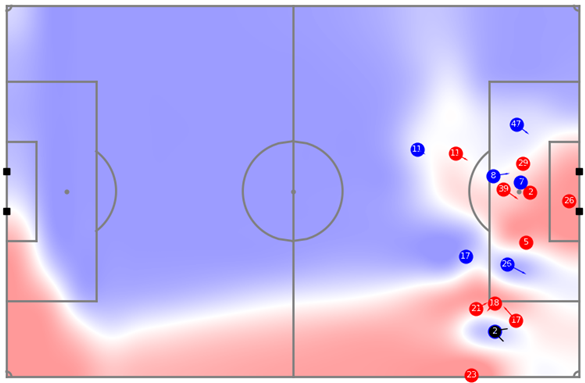
Zinchenko positioning is interesting because his “official” position in the line-up is left-back. Yet he is standing centrally, controlling the midfield area. It is this which allows De Bruyne to take a position where he can receive a short pass and, most importantly, it allows Gündogan the freedom to run into the box.
In this particular example, the pass from the left was unsuccessful and the ball went out for a throw-in. But after the throw-in, a new, very similar situation was created. Here is the position of the players when the ball was played into the box.
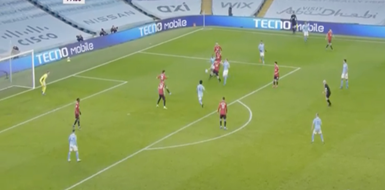
Zinchenko is now even more central and when the ball was cleared, it lands at his feet. City complete an under-five-second regain, partly because De Bruyne and Mahrez are pressing (with Gündogan on his way), but also because Zinchenko is well-positioned to regain a loose ball resulting from the press.
By setting up in this way – with the fullbacks playing in a midfield role whenever their teammates have the ball in the final third – Manchester City can both prevent counter-attacks and quickly regain possession. As a result, they can get more players into the box when attacking.
City lost this particular match, but they won the league and conceded very few goals. In terms of regaining the ball in the final third, in the area in front of the goal, they are the best in the Premier League. This season, they have regained the ball in front of the goal within 5 seconds after 25% of losses. For comparison, Manchester United have regained the ball within 5 seconds for only 15% of losses. In the long term, having a clear structure to play allows the team to improve the elements which are important to success.
Using tracking data to improve positioning
In the examples above, we only track the position of players broadcasted on TV, but using 22-player tracking data (which is available for most teams from their own league) we can see the positions of all players. Using this data, we can show players how they are controlling space, even when they are a long way from the ball. Pitch control becomes a powerful way of illustrating how each player’s off-ball positioning affects their teammates’ decisions.
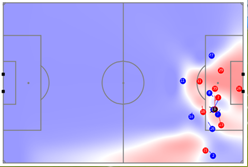
Below are two examples of player positioning, which I have used to help players improve their positioning.
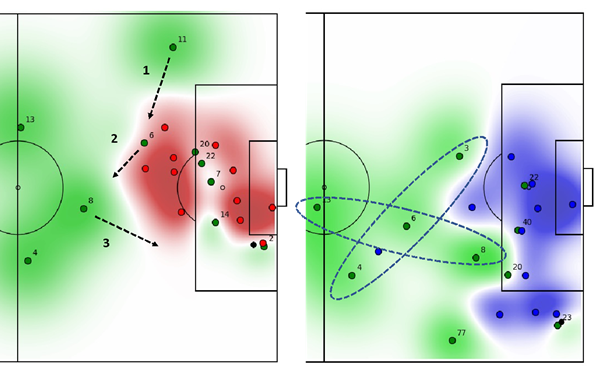
In the example on the left, the left-back in the green team (player 11) has taken a position wide on his wing, while the ball is in the box on the right (player 2). The arrows show how he can correct his position by moving centrally and, in doing so, allow one of the central midfielders (player 8) to get nearer to the edge of the box. In the example on the right, the team has a much better positioning. The left-back in this case (player 3) has come centrally, allowing the team to control the area outside the box: 6 central moves and 8 moves towards the edge of the box. Manchester City take this idea one step further, with the left-back coming all the way into the space otherwise occupied by the 6.
The dashed ellipse in the right-hand figure forms a cross-like shape, providing a template for players to follow. While five players attempt to complete a successful pass into the box, the other five cover as much space centrally as they can. A key point here is that – like the geese formations which we looked at in the first article and which we also know Pep Guardiola is so impressed with – a player’s task is to find the empty point in the defensive shape (in this case a point in the cross) and occupy it. No central planning is required, just an understanding of which positions need to be filled.
The dynamic cross “formation” discussed above is very different from the team’s playing formation or line-up (such as 4-3-3 or 4-4-2). A modern coach’s job is, based on the KPIs set up for the team, to provide these types of dynamic formations for a wide variety of situations: ranging from how the team should play out from the back to the way the team should press in each third of the field. Ideally, the description of each situation should be accompanied by straightforward “rules of thumb” for the players. In following these rules, playing position is less important than ensuring that a certain shape is preserved.
Analytics can be helpful, not just in setting the original KPIs, but also in visualizing how well the players are following the rules which we think will lead to better performance. In the examples above, we use the pitch control images to provide feedback directly to the players. In my own work, I have found that players respond well to this kind of visual feedback: they immediately see strengths and weaknesses in their own positioning (and that of their teammates).
The role of the coach is to translate tactics into well-defined dynamic formations. The role of the data scientist is to support the coach with tools which automatically identify these situations and allow for effective feedback to the players.
Together they can create the patterns of play that win matches.
KNOW MORE
CATEGORY: MARKETING, COMMUNICATION AND MANAGEMENT
This model looks to the future with the requirements and demands of a new era of stadiums, directed toward improving and fulfilling the experiences of fans and spectators, remembering “feeling” and “passion” when designing their business model.
CATEGORY: FOOTBALL SPORTS PERFORMANCE
Through the use of computer vision we can identify some shortcomings in the body orientation of players in different game situations.
CATEGORY: MEDICINE HEALTH AND WELLNESS
A health check must detect situations which, despite not showing obvious symptoms, may endanger athletes subject to the highest demands.
CATEGORY: FOOTBALL TEAM SPORTS
In the words of Johan Cruyff, “Players, in reality, have the ball for 3 minutes, on average. So, the most important thing is: what do you do during those 87 minutes when you do not have the ball? That is what determines whether you’re a good player or not.”
CATEGORY: MEDICINE HEALTH AND WELLNESS SPORTS PERFORMANCE
Muscle injuries account for more than 30% of all injuries in sports like soccer. Their significance is therefore enormous in terms of training sessions and lost game time.
DO YOU WANT TO KNOW MORE?
- SUBSCRIBE
- CONTACT
- APPLY
KEEP UP TO DATE WITH OUR NEWS
Do you have any questions about Barça Universitas?
- Startup
- Research Center
- Corporate