
One of the main characteristics of elite football players is their ability to perform different actions at maximum speed. Its importance is such that most goals are preceded by sprints. A study that analysed the Bundesliga goals in the second half of the season from 2007 to 2008 found that 45% of goals were preceded by a sprint.1 Consequently, the ability to generate high levels of power effectively throughout a season becomes a marker that can help assess the players’ fitness.
In this way, quantifying the maximum power an athlete is capable of producing at a specific moment has become a useful tool that provides information for coaches to determine deficits and assess individualised work plans based on it.
How can the Strength-Speed-Power Profile of a Sprint be Assessed?
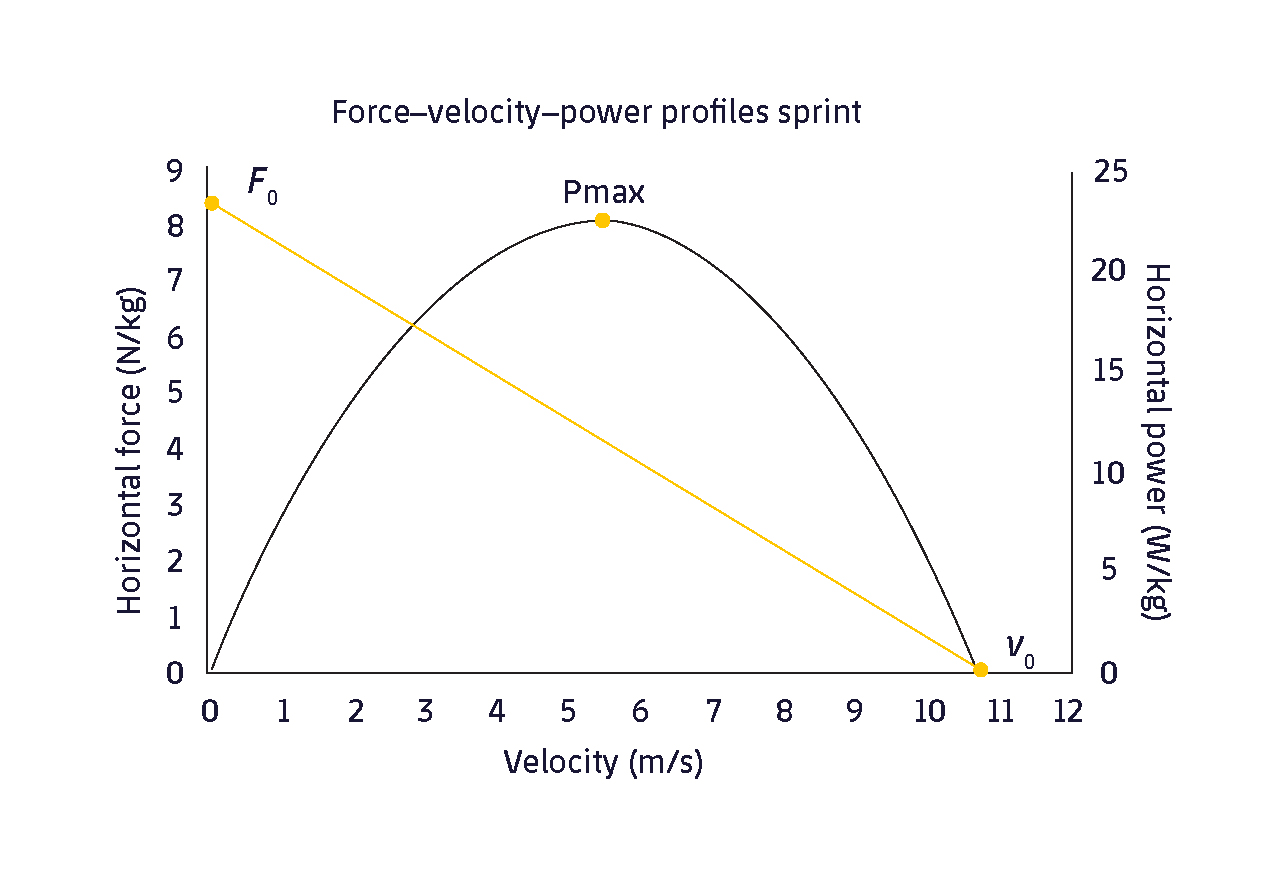
In recent years, two field tests offer, a simple and precise way to evaluate the strength-speed-power profile (SSP): the vertical jump test and the sprint test. The jump test, in spite of being related to athletic abilities and being the most widely used method to assess the power of the lower limbs, it also offers information that is specific to the ability to produce strength in a vertical direction. However, if we want to measure the SSP profile in a horizontal direction, Samozino and collaborators proposed a test using a 30-to-60-metre sprint that reliably determines the different variables of the SSP profile (Figure 1).2
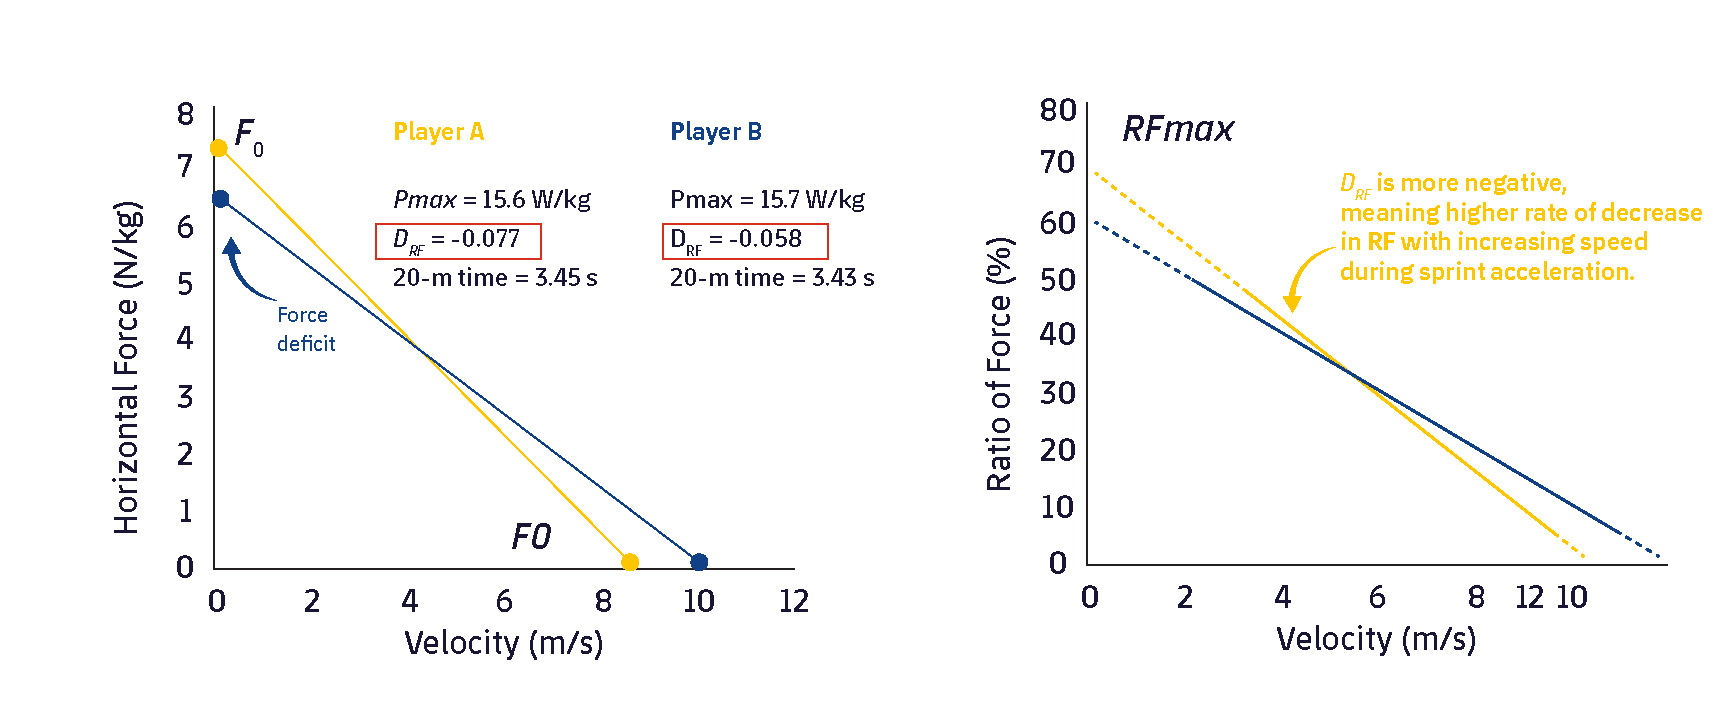
This test can help detect which components of the SSP profile need to be improved in order to propose a plan to correct specific deficits. For example, as it can be seen in Figure 2, two rugby players have performed a 30-metre sprint test in which they have obtained very similar values of power and execution time. A similar program for the two players will probably produce suboptimal adaptations in both players. However, if we analyse all the components of the profile, it can be seen that player B should emphasise a maximum strength work, while player A presents a lower efficiency in the application of strength as he accelerates, so the work should be focused on improving the speed deficit.4
Knowing the importance of explosive actions for performance, it would be advisable to maintain an SSP profile as optimal as possible throughout the season. In this sense, a recent meta-analysis has shown that if specific strength, plyometrics or speed work are added to general training, sprint speed can be improved in a greater extent rather than if only general football actions are trained.5 This highlights the importance of extending the specific work beyond the preseason, as the stimulus of training with the ball may not be enough to counteract the effects of fatigue accumulated during competition on the SSP profile.
How does the SSP Profile Vary on a Football Team Along a Season?
Knowing how the different parameters that determine the SSP profile of the different players vary throughout a season, could help make individualised decisions in order to maintain an optimal performance for key moments in the competition. Recently, a study that has analysed how the SSP profile varies in a professional football team during a season has been published, including the previous and subsequent preseason. Thus, prestigious researchers such as Dr. Pedro Jiménez-Reyes and Dr. Jean-Benoît Morin performed the sprint test (measurement with radar) on 21 players from a LaLiga team during 6 different moments in the league: preseason, 4 moments during the season and the subsequent preseason.6
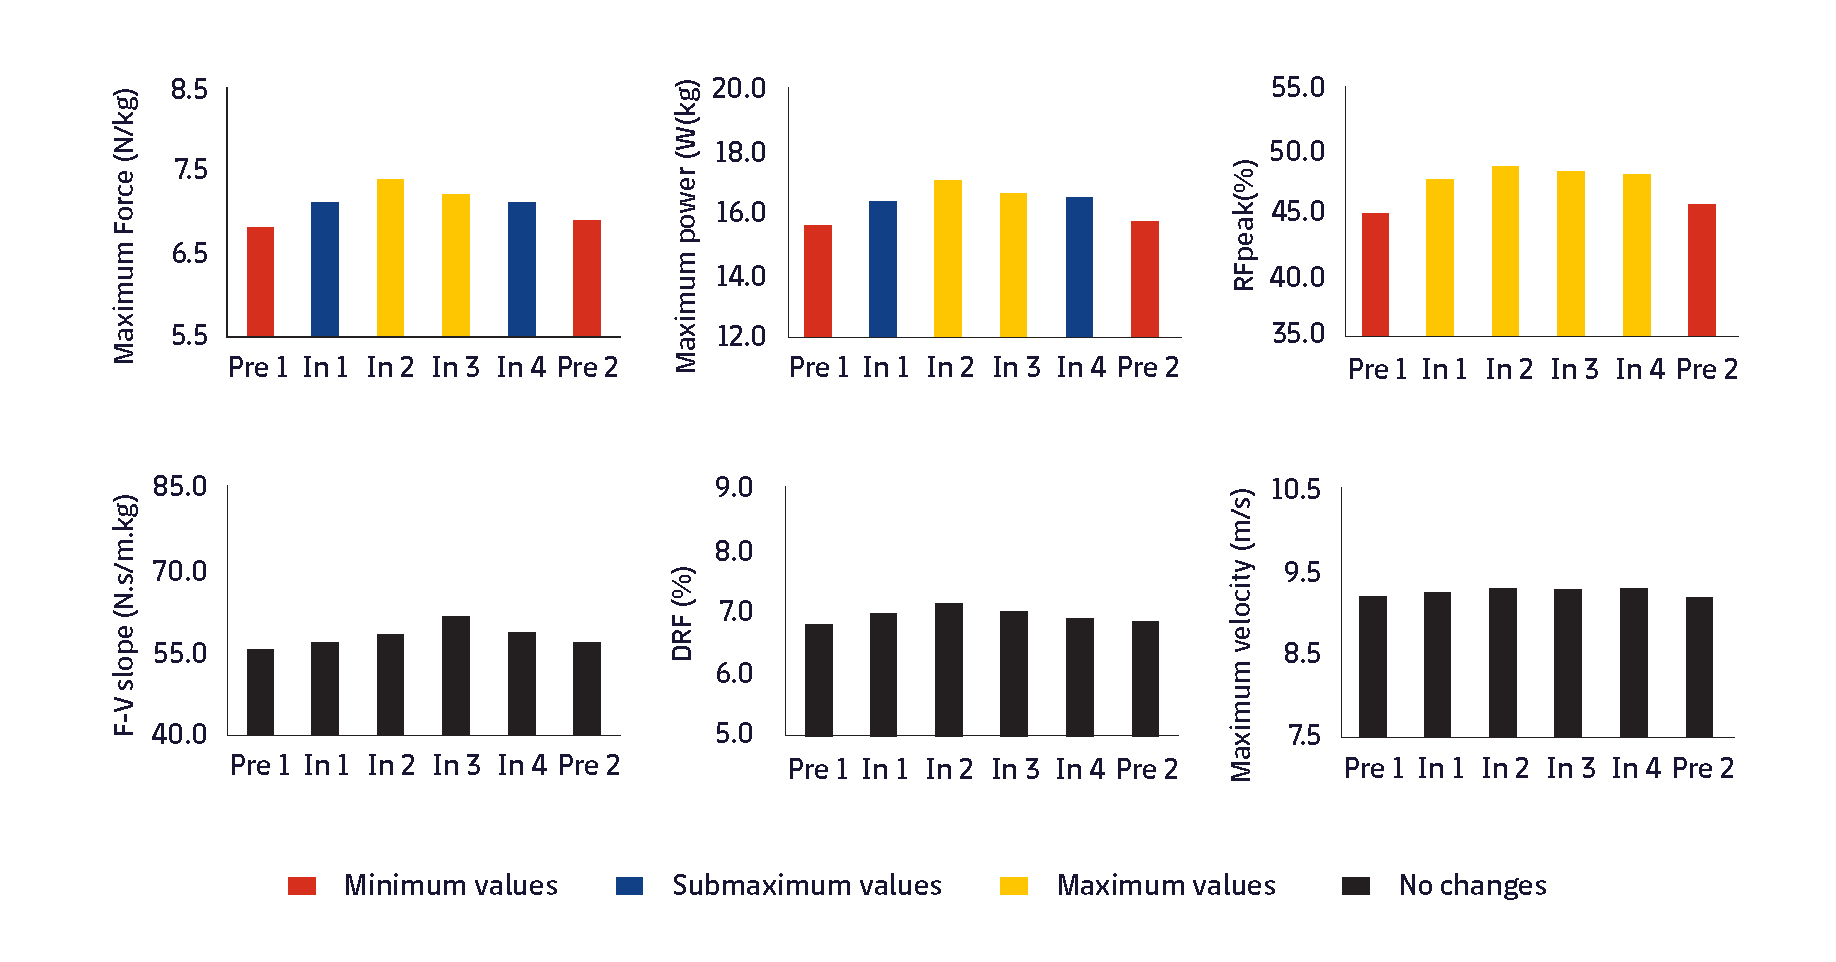
The results showed that 3 variables of the SSP profile changed significantly during the season: maximum strength (F0), maximum power (Pmax) and the maximum value of the force ratio (RFpeak). However, no significant changes were observed in the other 3 variables: maximum speed (v0), strength-speed slope (FVslope) and the variable that determines the decrease of the strength ratio as acceleration increases (DRF, ratio of horizontal-to-resultant force). As we can see in figure 3, F0, Pmax and RFpeak reached their maximum values in the middle of the season (2 and 3), but they decreased in the final stretch of the season. Since F0 y RFpeak are variables that are related to maximum acceleration capacity, these results suggest that elite football players should perform specific training to improve sprint performance, and thus prevent the decrease of variables related to maximum acceleration capacity at the end of the season. Furthermore, the decrease in F0 is important not only from a performance point of view but also because different studies have suggested that its decrease could be associated with a higher risk of hamstring injury.7,8
In summary, although this data cannot be extrapolated to all teams, it offers a benchmark to work on, and to try to optimise performance in the last stretch of the season. Furthermore, as the SSP profile shows these moments during competition where a player may have a deficit, it offers the possibility of implementing individualised work plan proposals.
BIHUB team
References:
- Faude O, Koch T, Meyer T. Straight sprinting is the most frequent action in goal situations in professional football. J Sports Sci. 2012;30(7):625–31.
- Samozino P, Rabita G, Dorel S, Slawinski J, Peyrot N, Saez de Villarreal E, et al. A simple method for measuring power, force, velocity properties, and mechanical effectiveness in sprint running. Scand J Med Sci Sports. 2016;26(6):648–58.
- Jiménez-Reyes P, Samozino P, García-Ramos A, Cuadrado-Peñafiel V, Brughelli M, Morin J-B. Relationship between vertical and horizontal force-velocity-power profiles in various sports and levels of practice. PeerJ. 2018;6:e5937–e5937.
- Morin J-B, Samozino P. Interpreting Power-Force-Velocity Profiles for Individualized and Specific Training. Int J Sports Physiol Perform. 2016;11(2):267–72.
- García-Ramos A, Haff GG, Feriche B, Jaric S. Effects of different conditioning programmes on the performance of high-velocity soccer-related tasks: Systematic review and meta-analysis of controlled trials. Int J Sports Sci Coach. 2018;13(1):129–51.
- Jiménez-Reyes P, Garcia-Ramos A, Párraga-Montilla JA, Morcillo-Losa JA, Cuadrado-Peñafiel V, Castaño-Zambudio A, et al. Seasonal Changes in the Sprint Acceleration Force-Velocity Profile of Elite Male Soccer Players. J Strength Cond Res. 2020;
- Mendiguchia J, Samozino P, Martinez-Ruiz E, Brughelli M, Schmikli S, Morin J-B, et al. Progression of mechanical properties during on-field sprint running after returning to sports from a hamstring muscle injury in soccer players. Int J Sports Med. 2014;35(08):690–5.
- Mendiguchia J, Edouard P, Samozino P, Brughelli M, Cross M, Ross A, et al. Field monitoring of sprinting power–force–velocity profile before, during and after hamstring injury: two case reports. J Sports Sci. 2016;34(6):535–41.
KNOW MORE
CATEGORY: MARKETING, COMMUNICATION AND MANAGEMENT
This model looks to the future with the requirements and demands of a new era of stadiums, directed toward improving and fulfilling the experiences of fans and spectators, remembering “feeling” and “passion” when designing their business model.
CATEGORY: FOOTBALL SPORTS PERFORMANCE
Through the use of computer vision we can identify some shortcomings in the body orientation of players in different game situations.
CATEGORY: MEDICINE HEALTH AND WELLNESS
A health check must detect situations which, despite not showing obvious symptoms, may endanger athletes subject to the highest demands.
CATEGORY: FOOTBALL TEAM SPORTS
In the words of Johan Cruyff, “Players, in reality, have the ball for 3 minutes, on average. So, the most important thing is: what do you do during those 87 minutes when you do not have the ball? That is what determines whether you’re a good player or not.”
CATEGORY: MEDICINE HEALTH AND WELLNESS SPORTS PERFORMANCE
Muscle injuries account for more than 30% of all injuries in sports like soccer. Their significance is therefore enormous in terms of training sessions and lost game time.
DO YOU WANT TO KNOW MORE?
- SUBSCRIBE
- CONTACT
- APPLY
KEEP UP TO DATE WITH OUR NEWS
Do you have any questions about Barça Universitas?
- Startup
- Research Center
- Corporate